WWDC 2025 · Session 详情
Bring Swift Charts to the third dimension
关于这场 Session
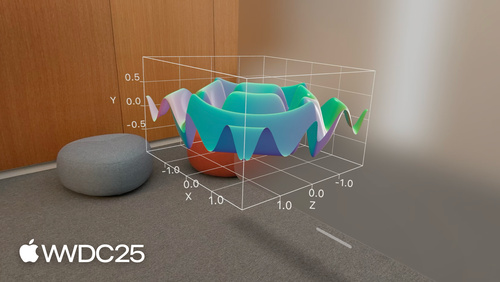
Learn how to bring your 2D Swift Charts to the third dimension with Chart3D and visualize your data sets from completely new perspectives. Plot your data in 3D, visualize mathematical surfaces, and customize everything from the camera to the materials to make your 3D charts more intuitive and delightful. To get the most out of this session, we recommend being familiar with creating 2D Swift Charts.
- 话题
- 平台
- 关键词